Locus Rank
38Gene
Id
181Gene Name
DOC2ADuplicated
FalseMaternal
FalseGene Not Within Locus (Nearby
FalseGene Description
There are at least two protein isoforms of the Double C2 protein, namely alpha (DOC2A) and beta (DOC2B), which contain two C2-like domains. DOC2A and DOC2B are encoded by different genes; these genes are at times confused with the unrelated DAB2 gene which was initially named DOC-2. DOC2A is mainly expressed in brain and is suggested to be involved in Ca(2+)-dependent neurotransmitter release. Mouse Phenotype
Additional Image
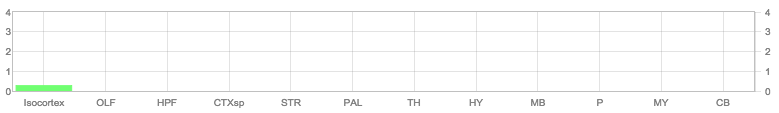
Allen Brain
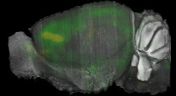
Allen Regions
Zfin In Situ
Zfin Brain Areas
Published Zebrafish Pehnotype
Not In Allen Brain
FalseZFIN Link
http://zfin.org/ZDB-GENE-090706-1Allen Link
http://mouse.brain-map.org/gene/show/13225More Additional Images
Papers
Locus Rank
Locus Rank
38Genes in Region
ALDOA ASPHD1 C16orf92 DOC2A FAM57B GDPD3 HIRIP3 INO80E KCTD13 MAPK3 PPP4C SEZ6L2 TAOK2 TBX6 TMEM219 YPEL3Associated Snps
rs12691307GWAS Region (hg19)
chr16:29924377-30144877Genes Skipping
ALDOA - definitely not; ASPHD1 - not in allen brain, and very unlikely; C16orf92 - nothing is known; FAM57B - hard to know, very little is known; GDPD3 - nothing in allen brain; HIRIP3 - histones; INO80E - maybe, but seems not that likely; MAPK3 - maybe; PPP4C - maybe, very unlikely; TAOK2 - maybe, but not in allen brain; TBX6 - not in allen brain, involved in development; TMEM219 - seems very unlikely, not in allen brain; YPEL3 - no.Ricopili Plot Surrounding Area
Distance On Each Side Of Locus In Above Plot
0.2 MBRicopili Plot
Gwas And Surrounding Region Pic
Gwas Region Pic
Sequence 1
Ensembl Gene Name
doc2aHarvard Allele
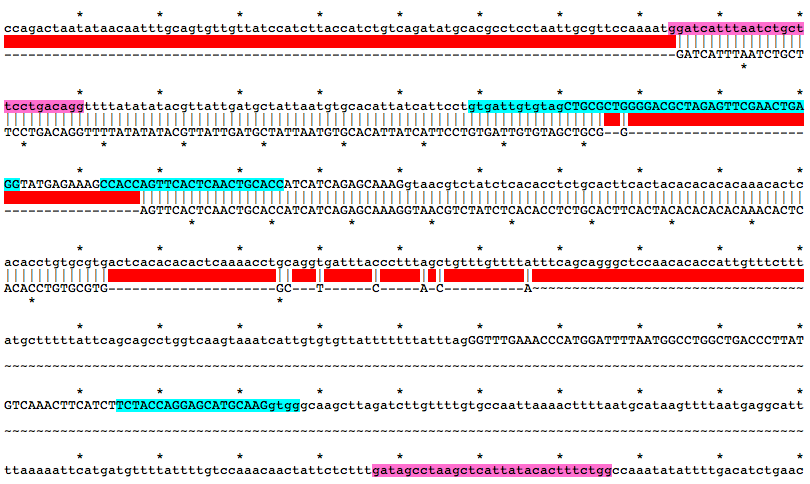
a263Mutation Area - WT DNA Sequence
ggatcatttaatctgcttcctgacaggttttatatatacgttattgatgctattaatgtgcacattatcattcctgtgattgtgtagCTGCGCTGGGGACGCTAGAGTTCGAACTGAGGTATGAGAAAGCCACCAGTTCACTCAACTGCACCATCATCAGAGCAAAGgtaacgtctatctcacacctctgcacttcactacacacacacaaacactcacacctgtgcgtgactcacacacactcaaaacctgcaggtgatttaccctttagctgtttgttttatttcagcagggctccaacacaccattgtttctttatgctttttattcagcagcctggtcaagtaaatcattgtgtgttatttttttatttagGGTTTGAAACCCATGGATTTTAATGGCCTGGCTGACCCTTATGTCAAACTTCATCTTCTACCAGGAGCATGCAAGgtgggcaagcttagatcttgttttgtgccaattaaaacttttaatgcataagttttaatgaggcattttaaaaattcatgatgttttattttgtccaaacaactattctctttgatagcctaagctcattatacactttctggMutation Area - Mutant DNA Sequence
GGATCATTTAATCTGCTTCCTGACAGGTTTTATATATACGTTATTGATGCTATTAATGTGCACATTATCATTCCTGTGATTGTGTAGCTGCGGAGTTCACTCAACTGCACCATCATCAGAGCAAAGGTAACGTCTATCTCACACCTCTGCACTTCACTACACACACACAAACACTCACACCTGTGCGTGGCTCACAGuide RNA Target Sites
gtgattgtgtagCTGCGCTGGGG
TCTACCAGGAGCATGCAAGgtgg
GGTGCAGTTGAGTGAACTGGTGG
GGACGCTAGAGTTCGAACTGAGG
Genotyping Primers
f, ggatcatttaatctgcttcctgacagg
r, ccagaaagtgtataatgagcttaggctatc
Alignment of WT and Mutant Sequences w/ gRNA Targets (cyan) and Genotyping Primers (pink) Shown on WT Sequence
Allele
41bpDWT Genotyping Size
593WT Protein Sequence
MTVRKGKKLTISIQEHMAIDVCPGPIRPIRQISAYFPRLSPTAEPVSPNPASPLSLSPGL
GASGGASGGLLSPLQAGARGGGGTLSAASSIETSVDICSSDSDDSTALGTLEFELRYEKA
TSSLNCTIIRAKGLKPMDFNGLADPYVKLHLLPGACKANKLKTKTVRNSLNPVWNETLTY
VGITEEDMHRKTLRLSVCDEDKLTHNEFIGESRVALRRVKPDQTKRFYTCLEHPPPLPSP
TAMGAALRGISCYLREWENEQMTSLEERGRLLLSLQFLPPPAEGEGESRRGGLCVGVLRC
AHLAAMDVNGFSDPYVKIYLKPDVKKKSKHKTSVIKKTLNPEFNEEFFYEISLSELVHKT
LEVTVWDYDLGRSNDFIGGVCLSCHVQGDALRHWMDCLRNKGQRVERWHILANELPQTTC
HD-
Mutant Protein Sequence
MTVRKGKKLTISIQEHMAIDVCPGPIRPIRQISAYFPRLSPTAEPVSPNPASPLSLSPGL
GASGGASGGLLSPLQAGARGGGGTLSAASSIETSVDICSSDSDDSTAEFTQLHHHQS
KGFETHGF-
Mutant Genotyping Size
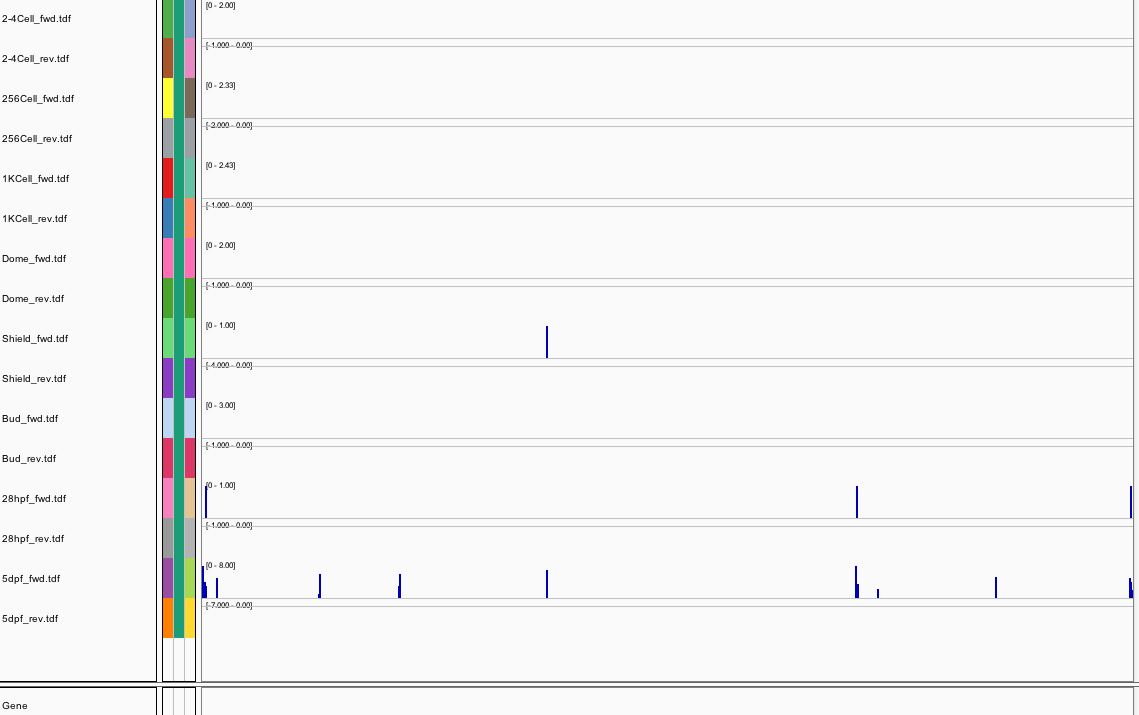
552Ribosome Profiling Development
Behavior Data
Behavior Data Summary
NoneBehavior Data Description 1
Dark flash block 1 start Merged section Pvalue = not significant 16 het vs 14 hom ribgraph_mean_ribbon_fullboutdata_dpix_a0darkflash103.pngBehavior Data Graph 1
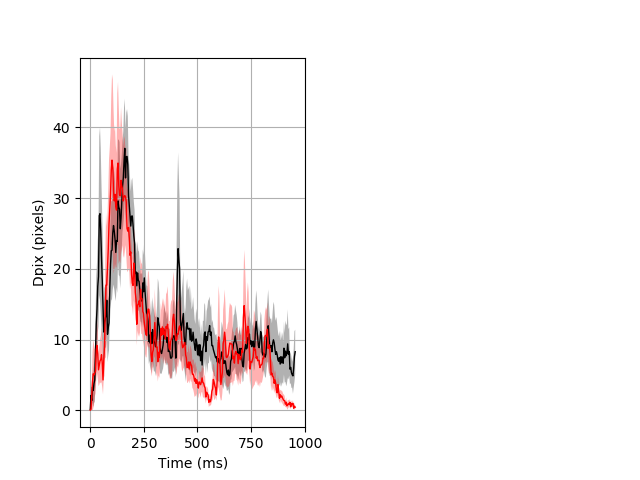
Behavior Data Description 2
Day all prepulse tap Merged section Pvalue = not significant 16 het vs 14 hom ribgraph_mean_ribbon_fullboutdata_dpix_dayprepulseinhibition100d.pngBehavior Data Graph 2
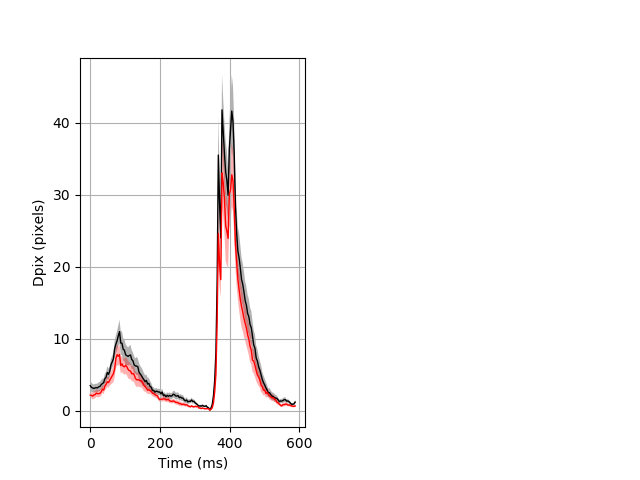
Behavior Data Description 3
Features of movement entire protocol Graph Pvalue = not significant Merged section Pvalue = not significant 16 het vs 14 hom ribgraph_mean_ribbonbout_aveboutdisp_10min_combo.pngBehavior Data Graph 3
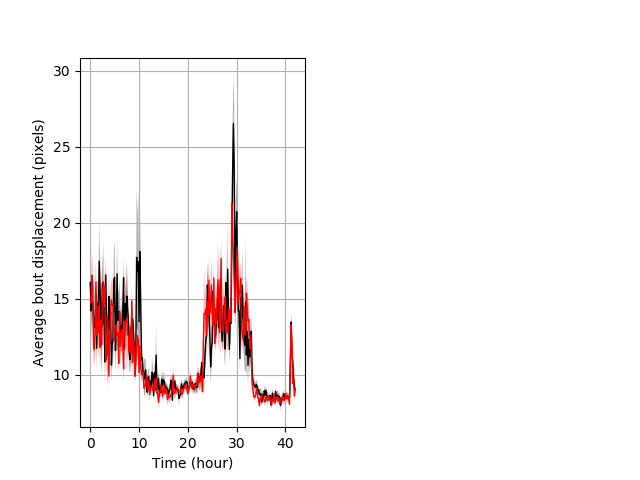
Behavior Data Description 4
Frequency of movement entire protocol Graph Pvalue = not significant Merged section Pvalue = not significant 16 het vs 14 hom ribgraph_mean_ribbonbout_dpixnumberofbouts_10min_combo.pngBehavior Data Graph 4
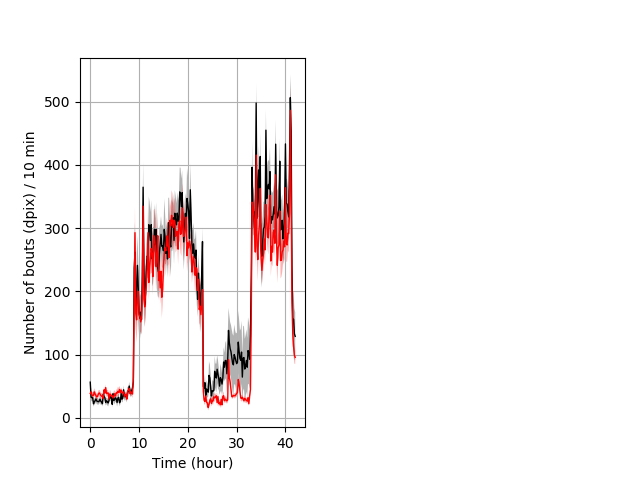
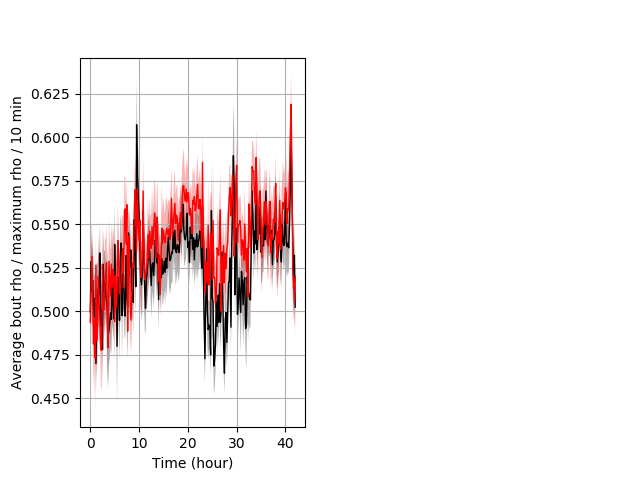
Behavior Data Description 5
Location in well entire protocol Graph Pvalue = not significant Merged section Pvalue = not significant 16 het vs 14 hom ribgraph_mean_ribbonbout_averhofrac_10min_combo.pngBehavior Data Graph 5
Behavior Data Description 6
NoneBehavior Data Graph 6
NoneBehavior Data Description 7
NoneBehavior Data Graph 7
NoneBehavior Data Description 8
NoneBehavior Data Graph 8
NoneBehavior Data Description 9
NoneBehavior Data Graph 9
NoneBehavior Data Description 10
NoneBehavior Data Graph 10
NoneBehavior Data Description 11
NoneBehavior Data Graph 11
NoneBehavior Data Description 12
NoneBehavior Data Graph 12
NoneBehavior Data Description 13
NoneBehavior Data Graph 13
NoneBehavior Data Description 14
NoneBehavior Data Graph 14
None